Analysing my music collection with Python and R
An analysis of my iTunes music collection that I did to put into practice what I learnt with the book Python for Data Analysis, from Wes McKinney (creator of pandas).
This analysis involved:
-
Importing and wrangling data in XML format (the iTunes Library.xml file) using Python libraries and turning it into
pandas’ dataframes. -
Using
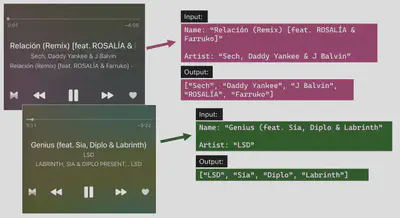
pandas’ data manipulation functions to answer questions such as Which are my most listened to songs, albums and artists? or Which genres predominate in each decade of my music? It was trickier than it sounds because of collaborations/remixes: songs attributed to multiple artists in which there is no standard format for how or where the contributors’ names should be written, so, regular expressions to the rescue.
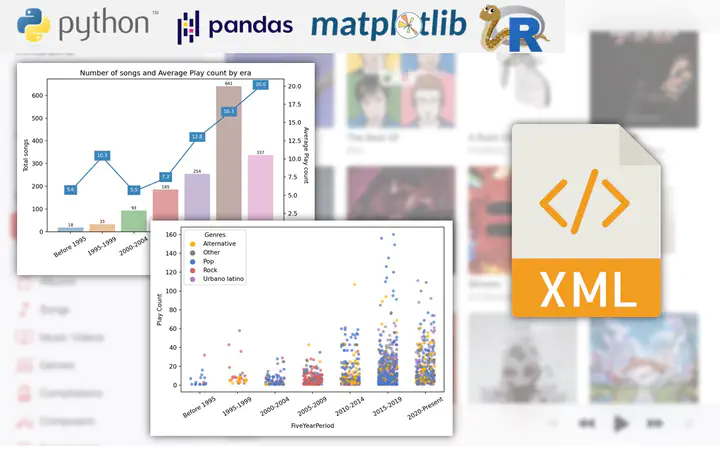
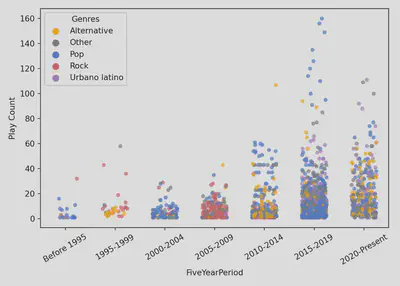
- Creating visualizations of my findings with
seabornandmatplotlib. For example:
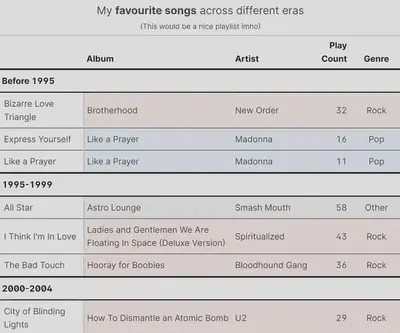
Finally, I expanded the analysis by passing the cleaned pandas dataframes to R through reticulate and then created a “Most listened to” song ranking by era and genre in HTML format using the package gt (a.k.a. the grammar of tables).
See the complete analysis here.