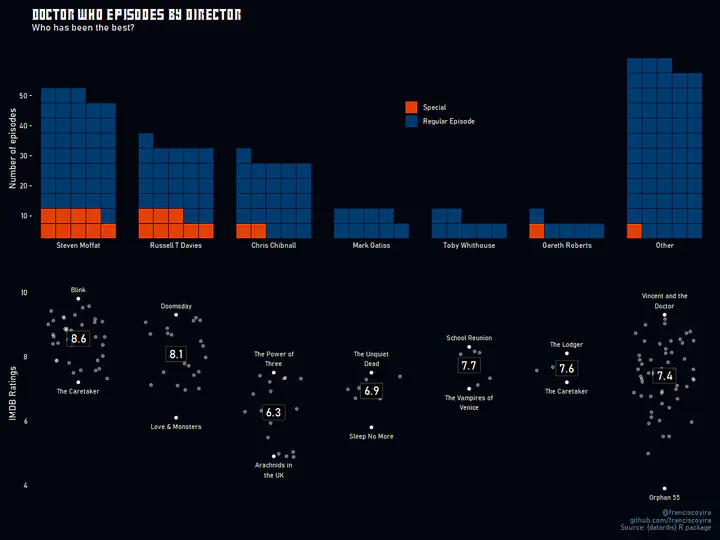
Visualization of IMDB data about Doctor Who episodes, showing the number of episodes and distribution of ratings by director. This plot uses custom ggplot themes and fonts to match Doctor Who’s TV show aesthetic.
This visualization was a contribution to #TidyTuesday, a project run by the R Community consisting of weekly challenges to clean and visualise public datasets. The data for this specific contribution was made available through the package datardis.